Key takeaways
- These are metrics the worlds best investors focus on.
- Return values can differ wildly between companies and industries.
- High returns on capital and space to grow into is the investing holy grail.
There are many ways of valuing companies and the returns they are expected to produce in the future. Price to earnings ratio and revenue/profit growth rates are very popular, they are good but don’t tell the whole story.
Some of the worlds best investors focus on metrics called Return On Capital Employed (ROCE) and Return On Invested Capital (ROIC). When these are understood, it makes a lot of sense why these are focused on.
First of all, it is worth recognising the returns the company makes and the return the companies stock makes can differ. Coca Cola Hellenic (CCH.L), which is a Coca Cola bottling company serving central/eastern Europe and parts of Africa, will be used as an example. This company is listed on the London Stock Exchange and is part of the FTSE 100, it is also one I used to own due to its great ROCE metric and growth opportunities.
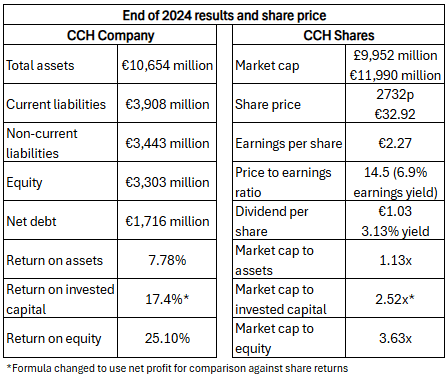
The comparison shows for the same company, the shares are valued more than the total assets of the company at that time. The shares are also valued at multiples of the invested capital and equity.
When shares in a company are bought, a portion of the company assets, capital and equity are bought at a price determined by the market. For CCH, the table above shows €1.13 is paid for every €1 of company assets or €2.52 for every €1 of company invested capital. A premium is paid on the shares to get access to the returns of the company
The 6.9% earnings yield on the CCH shares is the 17.4% ROIC divided by the 2.52x multiple paid for the invested capital.
ROCE and ROIC can also be compared between different companies and industries. Below is an extreme example comparing Coca Cola Hellenic to United Utilities which is a water company. Water companies are an asset heavy business where returns are heavy regulated, that keeps them low.
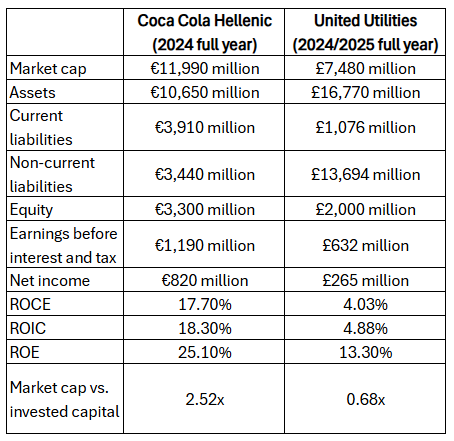
Although the example may not be completely fair, it does show how the returns on capital can vary dramatically between companies and industries. It also shows how companies can create wealth, with CCH valued more than the sum of its assets or the invested capital. Whereas, UU is actually worth less than the value of its assets or invested capital.
Banks and asset managers/insurance are examples of industries where ROCE/ROIC doesn’t provide a valid comparison or true assessment of their potential. Values in the low single digit % for both ROCE and ROIC are normal for this industry. Other means of assessing value and potential are used for these industries.
Investing holy grail
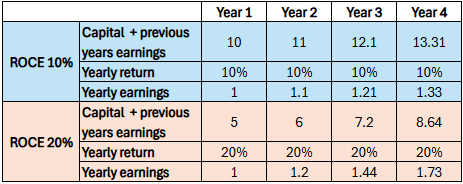
The holy grail of investing is finding a company with a high return on capital that has a lot of space to grow into. Hence can reinvest all it’s earnings at high rates for many years, that rate of return on capital can have a big impact on the performance.
Below shows the difference between 10% and 20% ROCE in companies that reinvest all their yearly earnings, the 20% ROCE company also starts with half the capital. Over time, the 20% ROCE company does significantly better than the 10% ROCE company.
Understanding ROCE and ROIC also explains why dividends aren’t the optimal way of maximising returns from shares. Some companies can earn great returns on the capital within the business, much better than the average return of the stock market. So it makes sense for them to retain those earnings within the business and aim to receive the same return on that additional capital as well.
To be able to reinvest these earnings, the company needs space to grow in to. This isn’t always possible and a major reason why dividends are paid, some mature companies pay out almost all of their earnings as dividends as there is little or no growth available to them. Companies also have the availability to borrow, so can pay out dividends and invest in the business at the same time.
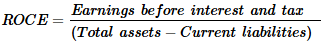
How are ROCE and ROIC determined
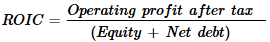
The ROCE and ROIC metrics are similar but use different inputs, this is why I use both. I’ve seen multiple different equations used for both ROCE and ROIC, as long as the same are used consistently they will be comparable. Below shows the equation that appear to be the most common;
Why ROCE and ROIC are better than ROE
ROCE and ROIC are better metrics than ROE as they include both equity and debt in the calculation. ROE ignores debt and can make companies with a large portion of debt appear to have a high return. From the example involving United Utilities above, the ROE is approximately 3x the ROCE/ROIC due to the large proportion of debt. Whereas for Coca Cola Hellenic, it is less than 1.5x.
The equity value of a company can be very small, or even negative, meaning the liabilities are close to or larger than the assets. Most of the time this is bad, but it will make the ROE appear high. I like to see what the ROE is, but don’t use it much further than that and use ROCE and ROIC.
How I have used ROCE and ROIC
ROCE and ROIC are key metrics to use, but not the only way to identify investing opportunities. There are a few examples in my current investments where ROCE/ROIC have played a part.
Vistry
The post Vistry – Will the strategy shift work? explains the full reasoning behind my investment in Vistry but to summarise it was mainly due to a change in business strategy that should result in a much improved ROCE. Combine that with a growing market, the need to build significantly more houses in the UK to keep up with demand, has the potential to increase earnings.
The revised business strategy also requires less capital invested, so whilst this is decreased the excess can be paid out in dividends or via a buyback. Either of these options further boost returns.
If this all comes to fruition, the share price will have to increase dramatically to keep up. When I invested in December 2024, the share price had seen a major decline due to negative news that should have now passed.
Carnival
Carnival is another major investment that was covered in the post Carnival Corporation – Sailing out of rough waters?. The cruise industry is a relatively asset heavy business due to the ships, so their ROCE and ROIC metrics won’t be that impressive compared to other industries. In fact, in their 2025 Q3 earnings report Carnival highlighted their return on invested capital reached 13% for the first time in 20 years as something positive.
It is positive in the sense it’s improving and approaching record levels in recent decades, but 13% isn’t particularly special in the investing world. My investment thesis behind Carnival is a play on the recovery of the cruise industry that was one of the most impacted by Covid-19. It is proceeding positively and it is good to see it still has an increasing momentum, but at some point it should succeed and have fully recovered.
At this point, the share price should have recovered as well and even if the 13% ROIC continues, earnings and share price growth are very unlikely to come close to the performance of the recent years. It would likely be a time to sell the Carnival shares and invest the capital in another investment that looks more promising. Although I’m anticipating the full recovery Carnival will take at least another 3+ years and am waiting for the 2028 Q4 earnings report.
As can be seen ROCE/ROIC isn’t the be all and end all for investing, but are a key part of my investing strategy.
